
📝 Add New Trade
📊 Trade History
| Date ↕ | Symbol ↕ | Type ↕ | Entry ↕ | Exit ↕ | Qty ↕ | Net P&L ↕ | Return % ↕ | Strategy | Emotion | Actions |
|---|
📈 Performance Charts
🎯 Advanced Analytics
🗓️ Trading Calendar
⭐ Premium FeatureRelated Tools
Trading Journal
Related Tools WHAT IS TRADEFLOW? TradeFlow is a free online trading journal designed to help traders track, analyze, and improve
XAUUSD Lot Size Calculator
XAUUSD Lot size calculator XAUUSD · Forex · Manage risk precisely Instrument Select currency pair or XAUUSD. Pip size and
XAUUSD Pip Calculator
XAUUSD Pip Calculator Gold · 1 pip = 0.01 · 1 standard lot = 100,000 units Account Currency USD ($)EUR
Dhan Brokerage Calculator
Dhan Brokerage Calculator Zero on delivery | ₹20 or 0.03% | rounded per rules Quantity Buying Price (₹) Selling Price
Zeodha Brokerage Calculator
Zerodha Brokerage Calculator Quantity Buying Price (₹) Selling Price (₹) Exchange BSE NSE Default BSE matches test case numbers Calculate
Finvasia Brokerage Calculator
Finvasia Brokerage Calculator Zero brokerage — just statutory charges Quantity Price (₹) Order Type Buy Sell Exchange BSE NSE Calculate
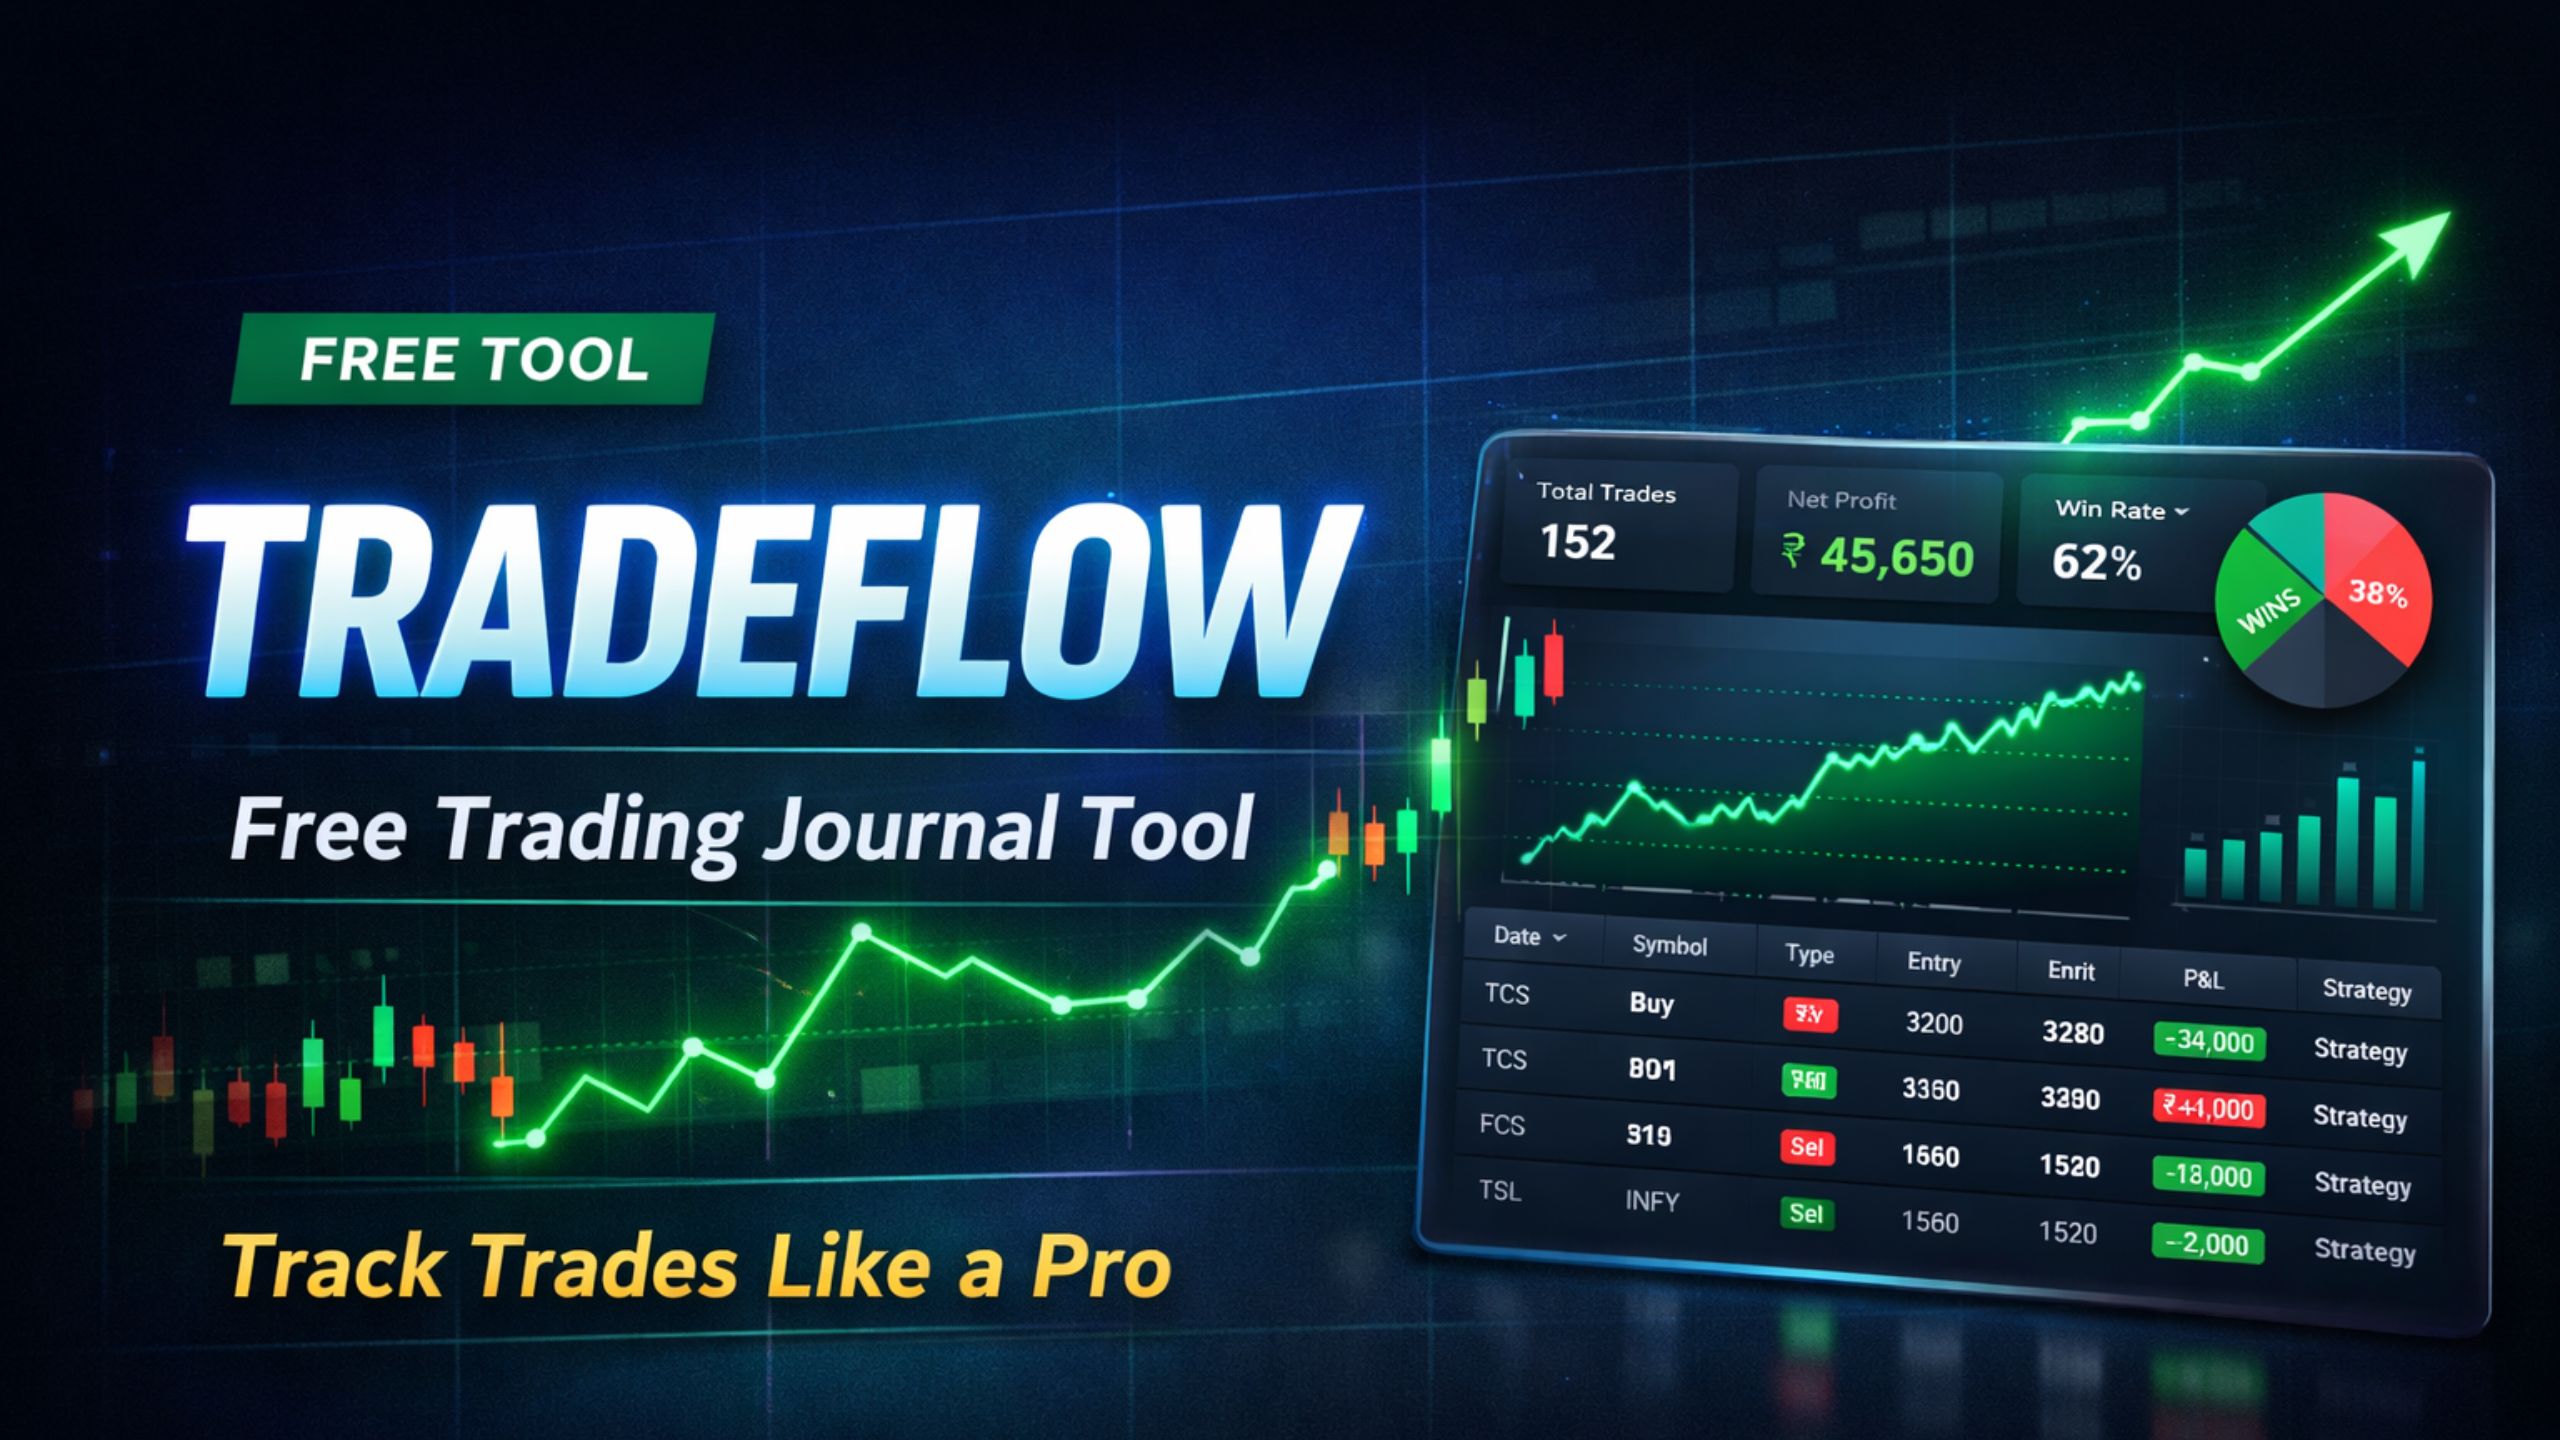
WHAT IS TRADEFLOW?
TradeFlow is a free online trading journal designed to help traders track, analyze, and improve their trading performance.
Unlike traditional Excel journals or complicated trading software, TradeFlow works directly in your web browser. There’s no software to download, no account to create, and no credit card required. Just open it and start tracking your trades immediately.
Built with the same modern technology used by professional fintech platforms, TradeFlow gives you powerful analytics and insights without the complexity. Your data stays private on your device, and you maintain complete control.
Whether you trade stocks, options, futures, or any other financial instrument, TradeFlow adapts to your trading style. It’s the journal that replaces messy spreadsheets with clean dashboards and real insights.
HOW TRADEFLOW HELPS TRADERS
Improves Trading Discipline:
The simple act of recording every trade makes you more intentional. You’ll think twice before entering impulsive trades when you know you’ll have to document the decision. TradeFlow builds the habit of systematic trading.
Identifies What Actually Works
Not all strategies are created equal. TradeFlow shows you exactly which approaches are profitable and which ones drain your account. See your win rate by strategy, average profit per setup, and which market conditions favor your edge.
Tracks Real Performance Metrics
Stop guessing. Know your exact win rate, profit factor, average win versus average loss, and current streak. These numbers tell the real story of your trading performance.
Removes Emotional Decision-Making
When you can see patterns in your losing trades, you spot emotional triggers. Trading out of fear? Revenge trading after losses? TradeFlow’s emotion tracking helps you identify and eliminate these costly behaviors.
Provides Visual Performance Insights
Numbers are important, but charts tell the story. Watch your equity curve grow over time. See monthly performance trends. Understand your trading journey at a glance with modern visualizations.
Works for Every Trading Style
Whether you’re an intraday scalper taking 20 trades a day, a swing trader holding positions for weeks, or a long-term investor, TradeFlow scales to your approach. Track whatever timeframe matches your strategy.
HOW TO USE TRADEFLOW
Getting started with TradeFlow takes less than 60 seconds. Here’s how:
Step 1: Enter Your Trade Details
Fill in basic trade information: the stock symbol, entry price, exit price, quantity, and trade date. Add your strategy tag and optionally note your emotional state during the trade. Takes about 30 seconds per trade.
Step 2: See Instant Calculations
TradeFlow automatically calculates your profit or loss, percentage return, and updates your statistics. No formulas needed. No manual math. Everything happens in real-time as you type.
Step 3: View Your Analytics Dashboard
Immediately see your updated equity curve, win rate, monthly performance, and advanced metrics. Every trade you add enriches your performance data and makes your insights more valuable.
Step 4: Analyze Patterns and Improve
Review which strategies work best. Check if certain emotions correlate with losses. Identify your strengths and weaknesses. Use these insights to refine your trading approach and make smarter decisions.
That’s it. No complicated setup. No learning curve. Just practical trade tracking that helps you improve.
KEY FEATURES OF TRADEFLOW
Easy Trade Entry System
Simple form-based input with helpful suggestions. Enter a trade in seconds, not minutes. All the important fields without overwhelming complexity.
Automatic Profit and Loss Calculation
Type your entry and exit prices, and TradeFlow instantly calculates gross profit, net profit after brokerage, and percentage returns. Math happens automatically.
Advanced Analytics Dashboard
Six key performance metrics are displayed prominently: total trades, net profit/loss, win rate, average profit, average loss, and profit factor. See your complete trading performance at a glance.
Equity Curve Visualization
Track your account growth over time with a clean, interactive chart. Spot winning streaks, drawdown periods, and overall trajectory instantly.
Strategy Tagging and Analysis
Tag each trade with your strategy: scalping, swing trading, breakout, reversal, or any custom approach. See which strategies actually perform and which need improvement.
Emotion Tracking
Record your emotional state during trades: confident, fearful, FOMO, revenge trading, or neutral. Discover how emotions impact your results and learn to trade more objectively.
Monthly Performance Reports
Automated monthly breakdown showing which months were profitable and which weren’t. Identify seasonal patterns or periods when your trading style works best.
Modern Charts and Graphs
Beautiful visualizations including equity curves, monthly bar charts, win/loss distribution, and strategy performance comparisons. Data that’s easy to understand and act on.
Mobile-Friendly Design
Access your trading journal from your phone, tablet, or computer. The responsive design works perfectly on any device, so you can log trades anywhere.
Privacy-First Approach
Your trading data stays on your device using local browser storage. No cloud uploads. No data sharing. No login required. Complete privacy and control.
Export Capabilities
Download your complete trade history as a CSV file anytime. Keep backups, import into other tools, or share with mentors or accountability partners.